Analysis with Python[Pandas, Matplolib] on Data.gov.in portal data
Python is increasingly being used as a scientific language. Matrix and vector manipulations are extremely important for scientific computations.
In Data science NumPy [Numerical Python], Pandas and Matplotlib have emerged to be essential libraries for any scientific computation, including machine learning, in python due to their intuitive syntax and high-performance matrix computation capabilities.
What is NumPy?
NumPy stands for ‘Numerical Python’ or ‘Numeric Python’. It is an open source module of Python which provides fast mathematical computation on arrays and matrices. Since, arrays and matrices are an essential part of the Machine Learning ecosystem, NumPy along with Machine Learning modules like Scikit-learn, Pandas, Matplotlib, TensorFlow, etc. complete the Python Machine Learning Ecosystem.
What is Pandas?
Similar to NumPy, Pandas is one of the most widely used python libraries in data science. It provides high-performance, easy to use structures and data analysis tools. Unlike NumPy library which provides objects for multi-dimensional arrays, Pandas provides in-memory 2d table object called Dataframe. It is like a spreadsheet with column names and row labels.
What is matplotlib?
Matplotlib is a 2d plotting library which produces publication quality figures in a variety of hardcopy formats and interactive environments. Matplotlib can be used in Python scripts, Python and IPython shell, Jupyter Notebook, web application servers and GUI toolkits.
I have done a small run down project using Pandas, Matplotlib.
Source file(CSV) is generated from Data.gov.in - All India level and State-wise Key Indicators of NFHS-3 and NFHS-4 Data set.
Step 1: Reading data from CSV file using pandas
# Load a small real dataset from CSV file and split it into input and output elements

import pandas as pd
import matplotlib.pyplot as plt

# Reading CSV file to Data Frame

newdf = pd.read_csv('NFHS-data.csv')

numeric_cols_list = list(newdf.columns)[0:5]

# Validation of data to numeric format

for k in numeric_cols_list:

    newdf['k'] = pd.to_numeric(newdf[k],errors='coerce')

# Replacing NaN values to 0

newdf.fillna(0, inplace=True)

newdf = newdf[numeric_cols_list]

# print col3 and col4 names

x = newdf.columns[3]
y = newdf.columns[4]

print("column no 3 value --->", x)
print("column no 3 value ---->", y)

df1 = newdf.copy()
Now, we have refined and extracted required columns from large dataset.
Step 2: Renaming the columns, Filtering data
we can create a new data frame and select required columns to work
# changing index cols with rename()

df1.rename(columns={x: "Femaleage6attendeschool", y: "Householdbelowage15years"}, inplace=True)

# Filter rows based on condition


df_filtered = df1[df1['Femaleage6attendeschool'] > 0]

df_filtered = df1[df1['Area'] != 'Total']
Step 3: Generating the Barchart
# plotting the values of Female-age-6-years-and-above-attended-school Mean with reference to states

# creating a new dataframe

df_filtered.iloc[:,[0,1,3]]

df_filtered.groupby("India/States/UTs")['Femaleage6attendeschool'].mean()

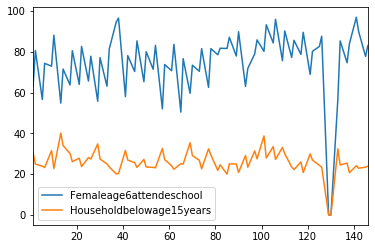
df_filtered.plot()
Step 4: Final Image Generated

Read more: